LLM Serving System:V1
July 2, 2025
Ever wonder how language models stream responses word by word while juggling hundreds of users and still staying responsive? That question led me down the rabbit hole of real time inference infrastructure. I wanted to peel back the layers and understand what it really takes to serve large models efficiently under load, with low latency, and without crashing the system. So I started a self-driven project to build a complete LLM serving system from scratch, exploring the layers of complexity that lie between receiving a prompt and delivering a streamed response.
This blog walks through that system: how it's architected, the real problems it solves, and the thinking behind each design decision. If you're curious about the systems side of LLMs, you're in the right place.
Challenges
Before diving into how the system works, let’s first understand why serving LLMs is far from trivial. From performance expectations to fault handling, the challenges are surprisingly deep, involving many moving parts that must work seamlessly together under pressure.
- Users expect interactive, streaming outputs.
- The system must scale with load and efficiently handle thousands of concurrent requests.
- Requests need to be routed intelligently to the appropriate execution nodes based on availability and load, often spanning multiple VMs.
- Partial failures are common — components can crash, networks fail, and the system must gracefully handle these events.
- The system must remain observable at every layer to support autoscaling, debugging, and optimization.
This system was built with these challenges at its core, shaping the design of the components you'll explore next.
System Overview
This is a microservices based distributed system built on an async, event-driven architecture. Each service operates independently and communicates internally over gRPC. The system runs across multiple nodes(in this case, VMs) where:
- The Head node hosts the Head Controller and the HTTP Proxy.
- The Worker nodes run the Scheduler and their associated Replicas.
Here are the core building blocks:
- HTTP Proxy — The entrypoint that handles incoming requests and balances traffic.
- Head Controller — The orchestrator that maintains system health and deployment state.
- Scheduler — The intermediate layer that manages replicas.
- Replica -The execution unit that runs the model and streams back tokens.
We’ll now break these down in more depth across the control and data planes.
Architecture Overview
With the system’s components introduced, the next step is to see how they interact. To simplify this, the architecture is organized into two complementary planes:
- Control Plane — Manages system health, deployment state, and routing updates.
- Data Plane — Handles model execution and token streaming.
While the same services participate in both, their behavior and responsibilities shift depending on which plane they’re operating in. Let’s look at each in turn.
Control Plane
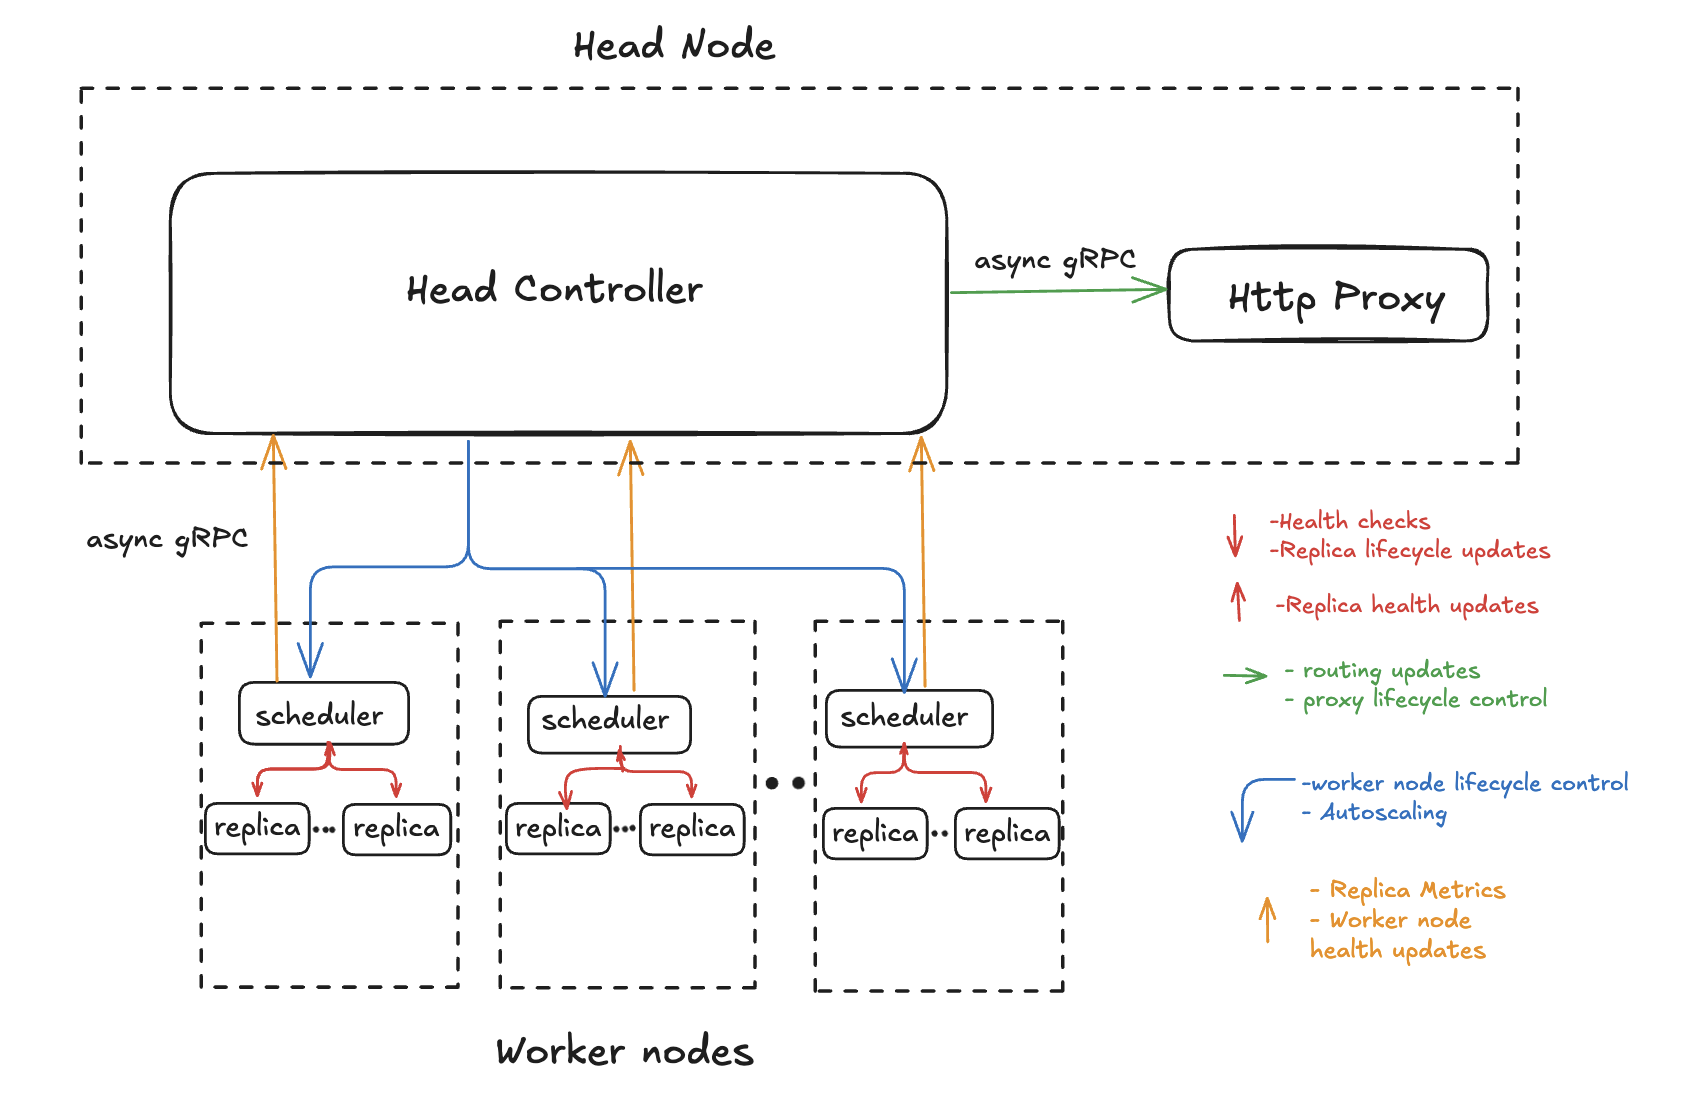
At the heart of the control plane is the Head Controller. It acts as the system's central coordinator:
- Registers and tracks active schedulers
- Keeps routing table with mapping between deployment and replicas
- Pushes replica assignments to those schedulers
- Manages life cycle of HTTP Proxy
- Broadcasts routing updates to the HTTP proxy using a pub-sub model
- Collects and interprets health metrics from the schedulers to maintain global system integrity
Schedulers act as a bridge between the control and data planes. Their responsibilities in the control plane include:
- Registering with the Head Controller when they start
- Receiving assignment instructions from the Head Controller
- Monitoring local replica life cycle using instructions from the Head Controller
The HTTP Proxy, while primarily responsible for handling requests in the data plane, participates in the control plane by subscribing to routing table updates from the Head Controller using a gRPC based pub-sub model. This ensures the proxy stays in sync with the latest deployment state and routes traffic only to healthy and available backends.
Data Plane
The data plane handles all client traffic and inference.
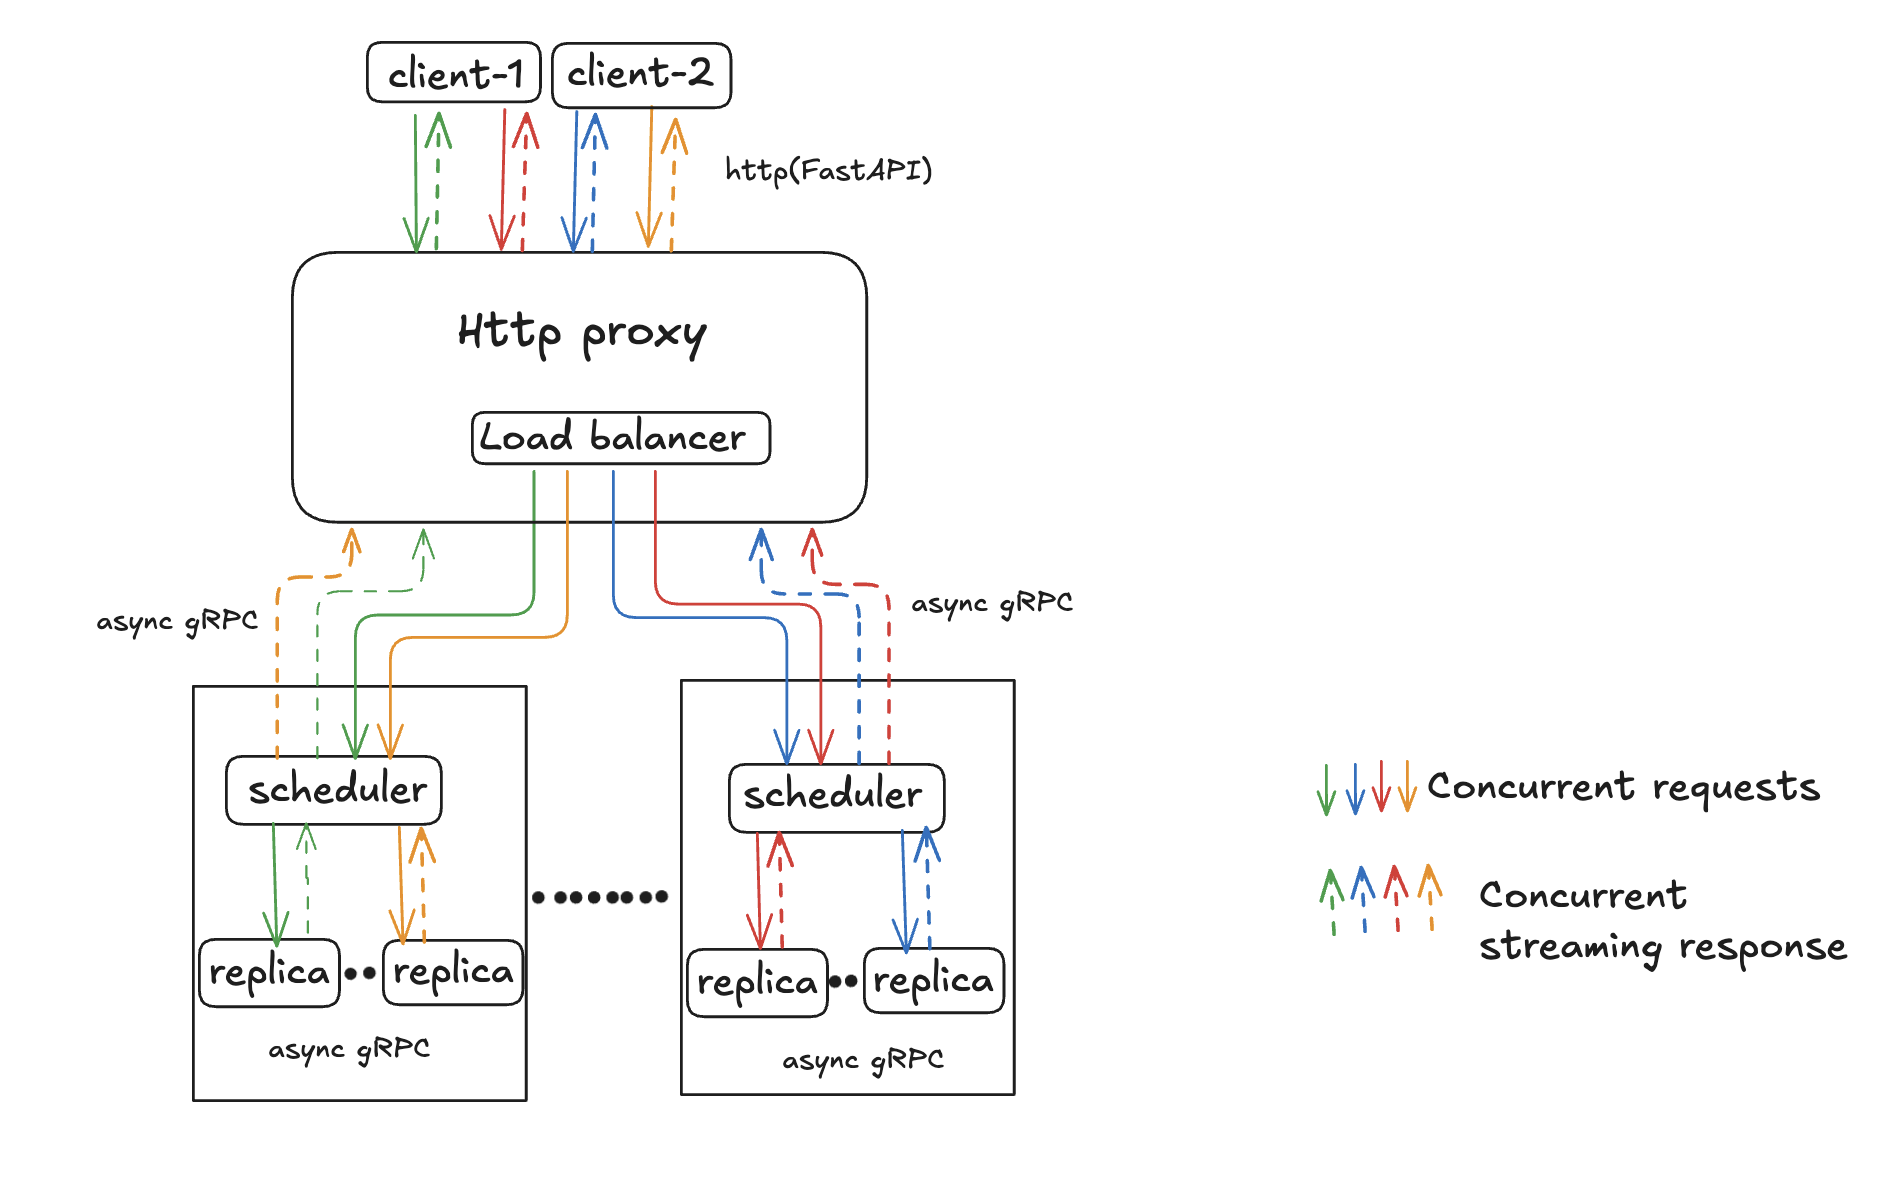
This layer is built for concurrency, responsiveness, and throughput. It orchestrates the flow of user requests through the proxy, routes them to backend workers, and ensures the output is streamed efficiently and reliably
The HTTP Proxy runs a stateless, async FastAPI server on the frontend to handle incoming HTTP requests from clients, and communicates with backend schedulers using an async gRPC client. It:
- Receives user prompts via POST requests
- Uses a local routing table (pushed from the controller) to forward requests to a scheduler
- Includes a lightweight load balancer that selects the least loaded replica for optimal distribution
- Streams token responses back as they are generated.
Schedulers act as intermediaries between the proxy and the replicas in the data plane. They:
- Receive inference requests from proxies via gRPC
- Place those requests into the appropriate replica queues
- Forward requests asynchronously to replicas for execution
Replica is a subprocess responsible for running the actual inference workload. It:
- Loads a specific LLM model (e.g., TinyLlama)
- Accepts gRPC requests from the scheduler
- Processes input prompts using vLLM's continuous batching engine
- Streams tokens back incrementally
Together, these components form the backbone of a real time, distributed inference system.
Design Decisions
Let’s talk about a few of the core architectural choices behind this system and more importantly, why they were made. Each one was driven by practical needs uncovered during implementation.
- gRPC- I chose gRPC because real time streaming is essential when working with token based LLM outputs. gRPC provides bi-directional streaming and Protobuf based contracts that make communication between services efficient and strongly typed. It also gave me structured APIs and easy versioning as the system evolved.
- Async- Most operations in this system, from streaming token output to inter-service communication, are IO bound. To keep the system responsive under load, I designed it around async programming. All major components use non-blocking async def functions, enabling efficient concurrency without thread contention.
- Pub-Sub for Proxy Updates-Polling for routing updates adds overhead by repeatedly checking for changes that may not exist. Instead, the proxy subscribes to the Head Controller at startup, and updates are pushed only when routing configuration changes. This approach reduces load and also supports future horizontal scaling
- Scheduler- The Scheduler serves as a key intermediary between the proxy and replicas. Rather than letting the proxy send requests directly to each replica, the scheduler centralizes replica coordination and keeps the proxy logic clean and lightweight. This also helps in isolating the Head Controller from directly interacting with the replicas.
- Replica Isolation- Each replica runs in its own process to ensure failures are contained and don't affect other replicas. This also makes it easier to scale replicas independently.
- vLLM integration- vLLM is a library that provides a high performance, flexible, and easy to use framework for building LLM applications. It supports continuous batching and efficient token streaming, both of which dramatically increase throughput.
Deployment Setup
Before benchmarking the system, I deployed it entirely on virtual machines (VMs) in AWS, using a containerized deployment flow that ensured reproducibility and fast scaling.
- Controller Deployment: The controller was packaged as a Docker image and pushed to AWS ECR. An EC2 instance (c5.large) was provisioned using an automated deployment script, which installs Docker, pulls the image, and runs the controller with exposed ports.
- System Bootstrap: Once running, the controller initializes all its internal managers (deployment, health, autoscale), spins up the HTTP proxy, and listens for schedulers to register. It also provisions 4 additional EC2 VMs with A10 GPU and 16GB VRAM to host the scheduler services.
- Scheduler Containerization: Like the controller, the scheduler was also containerized and pushed to ECR. When a new VM is created for a scheduler, it pulls the image and runs the scheduler service inside a Docker container enabling consistent lifecycle management across all worker nodes.
- Monitoring setup: A similar containerized setup was used for Prometheus and Grafana. Once the monitoring VM launched, it pulled the prebuilt images from ECR and ran both services. Prometheus scraped metrics from the proxy and replicas every 5 seconds, and Grafana was used to visualize them.
Load Testing & Evaluation
To evaluate the system’s performance under concurrent traffic, I used Locust to simulate real user load against the deployed infrastructure.
This section focuses on one representative test case to illustrate the system's behavior under load. Additional test scenarios will be added to the repo linked below.
Load Test Insights
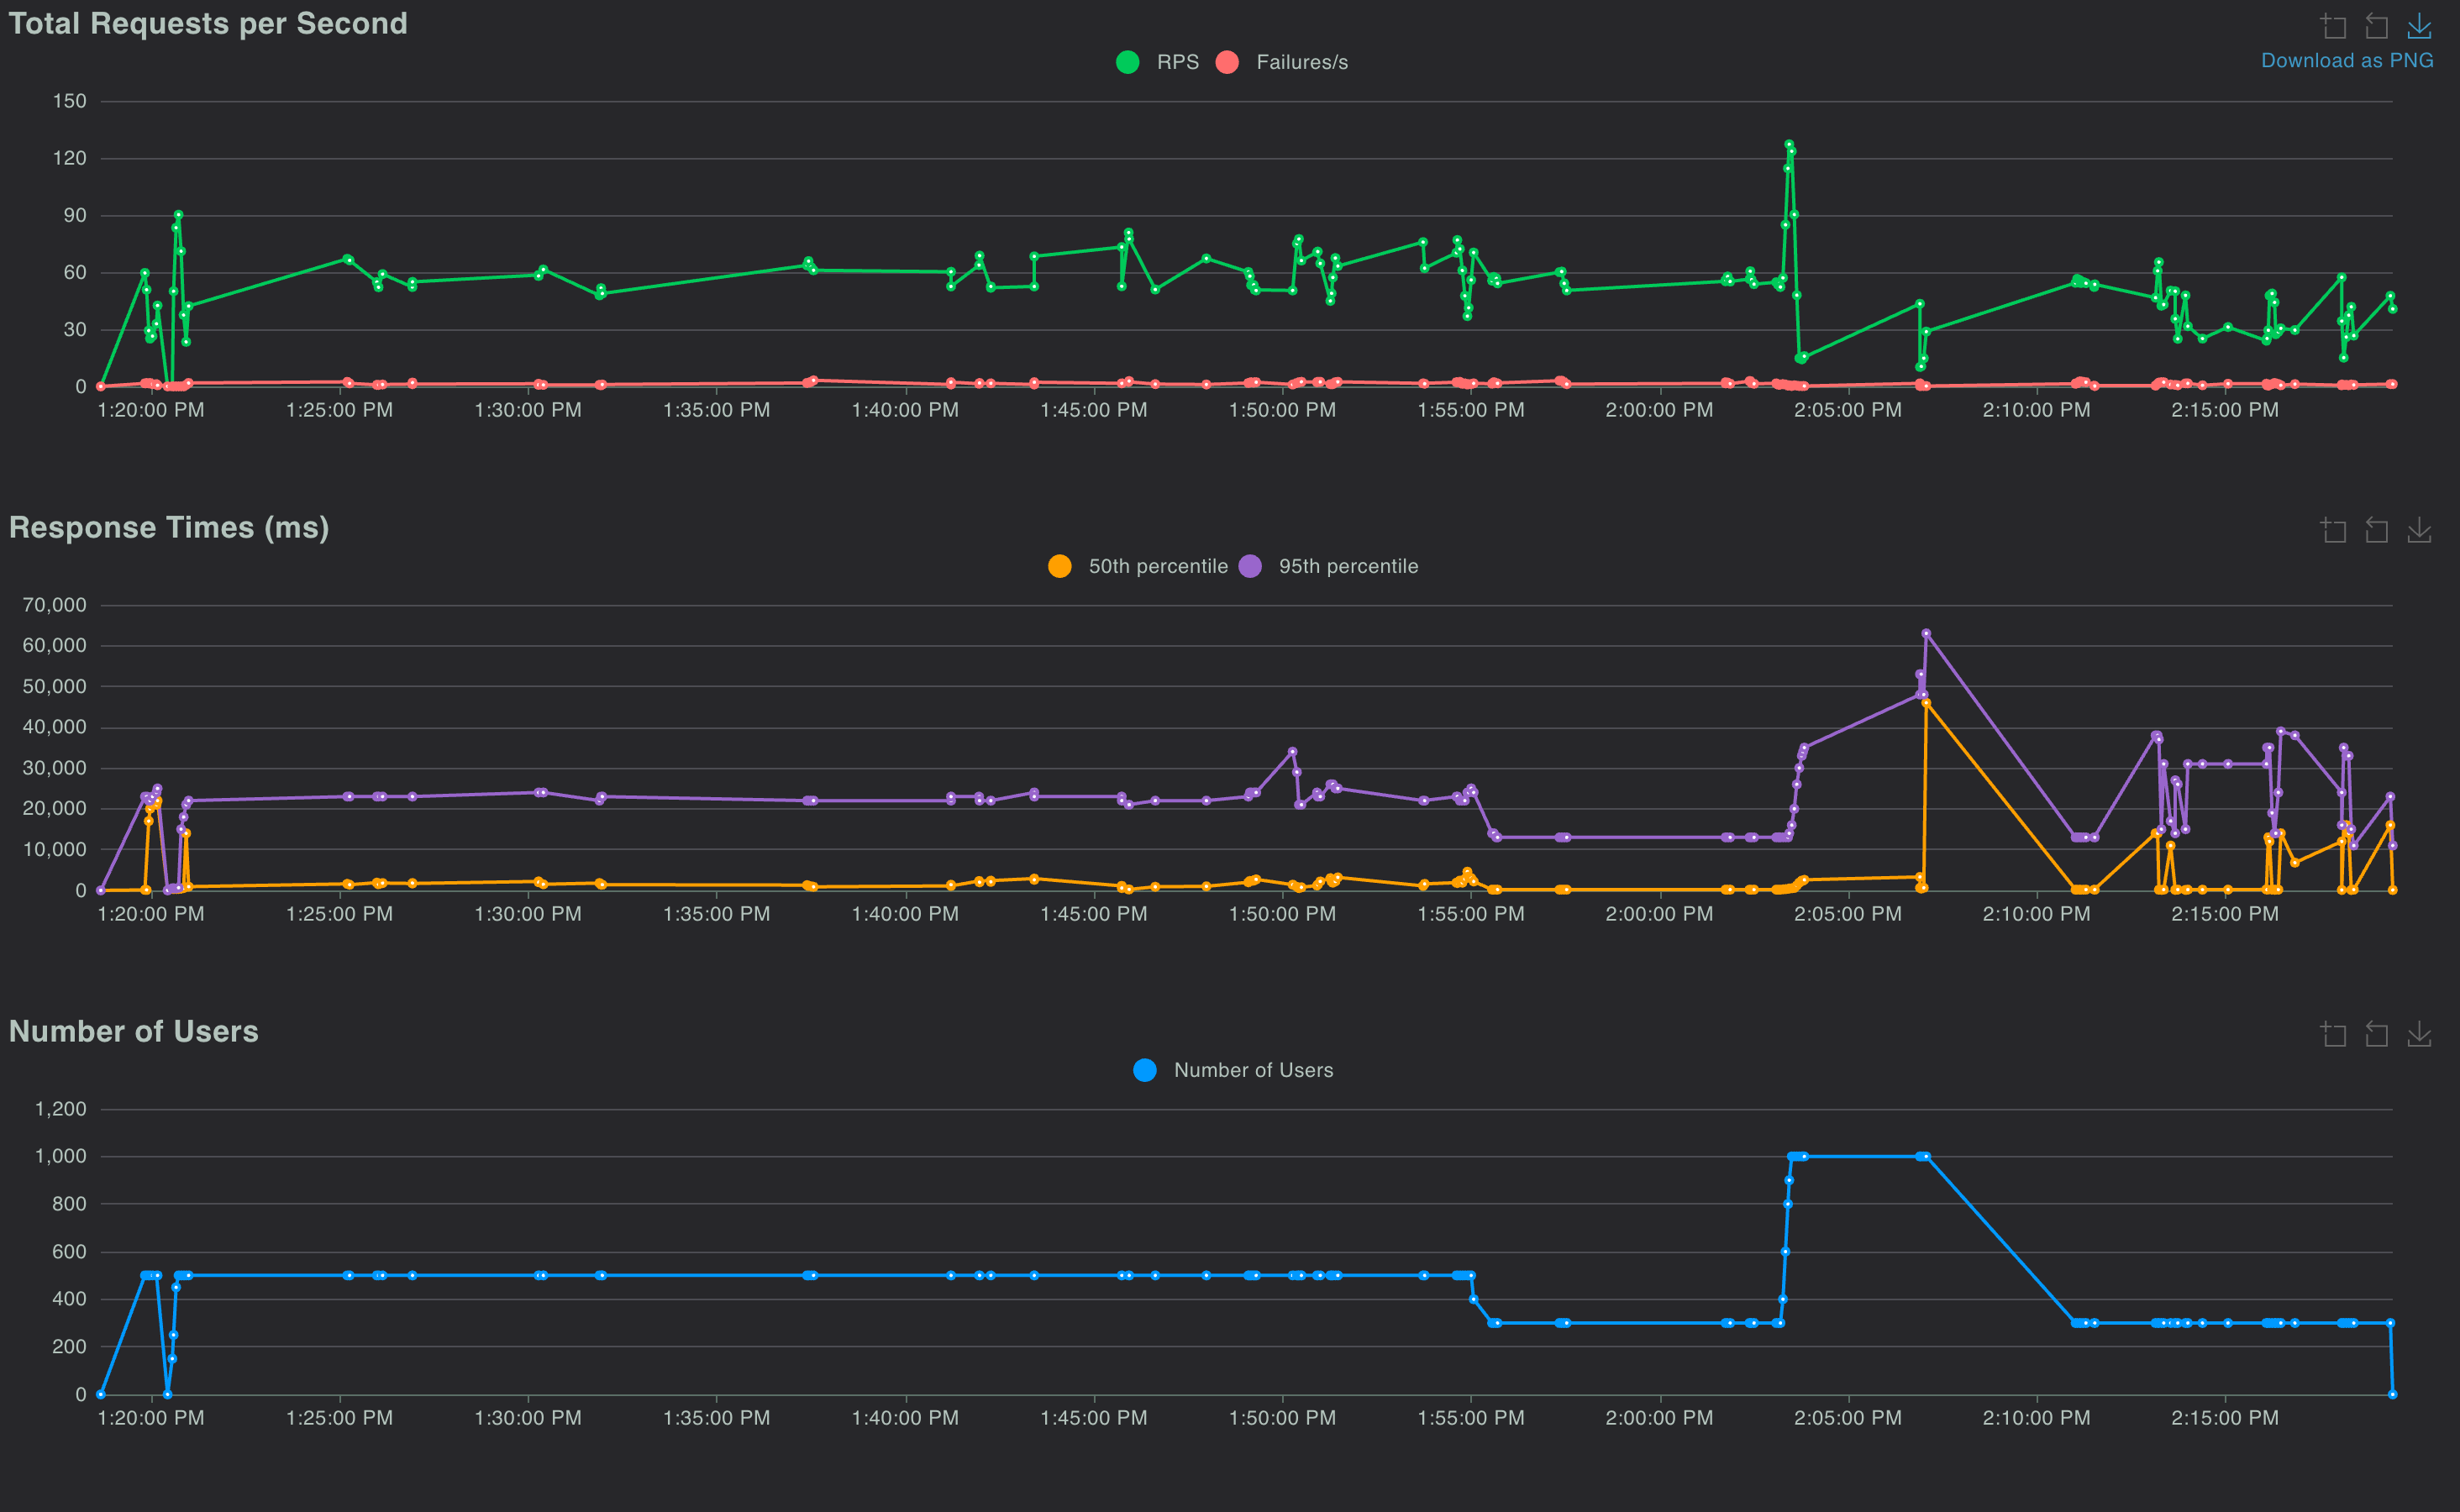
- The system was tested using Locust with up to 1,000 concurrent users, simulating realistic traffic patterns.
- Each request used a medium length prompt of 300–500 tokens and requested up to 500 output tokens.
- All requests were served by 4 active replicas running the TinyLlama model, deployed on separate VMs with A10G GPU and 16GB VRAM.
- During the test, the system sustained 80–100 requests per second consistently, with very low failure rates.
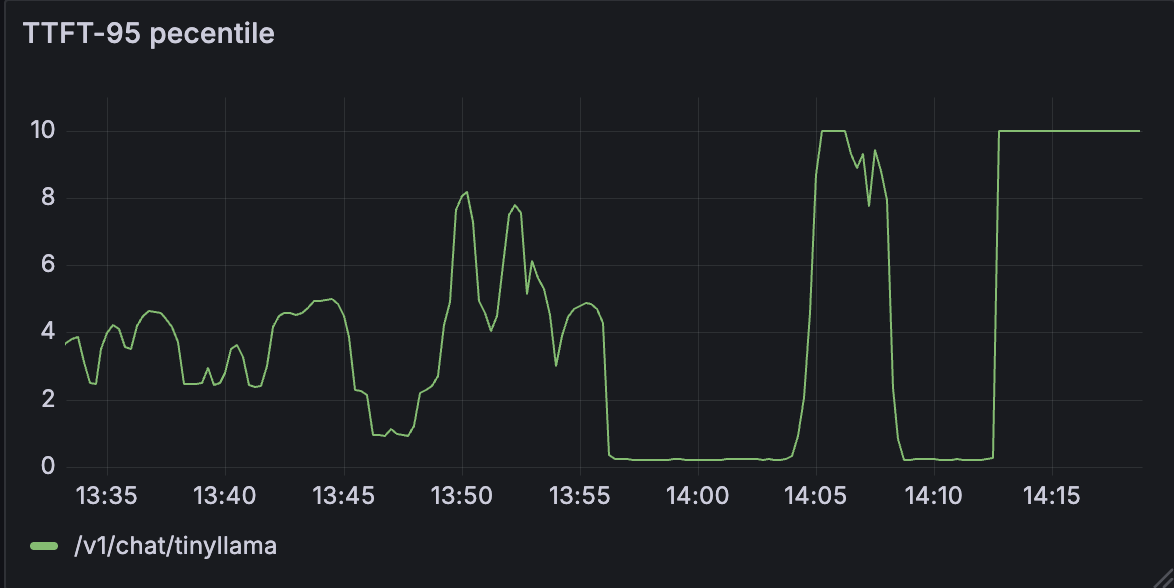
Prometheus metrics were monitored alongside Locust to capture deeper infrastructure behavior:
- System responsiveness - 95th percentile TTFT stayed between 3–4 seconds under normal load and rose above 10s during bursty traffic (14:05–14:10)
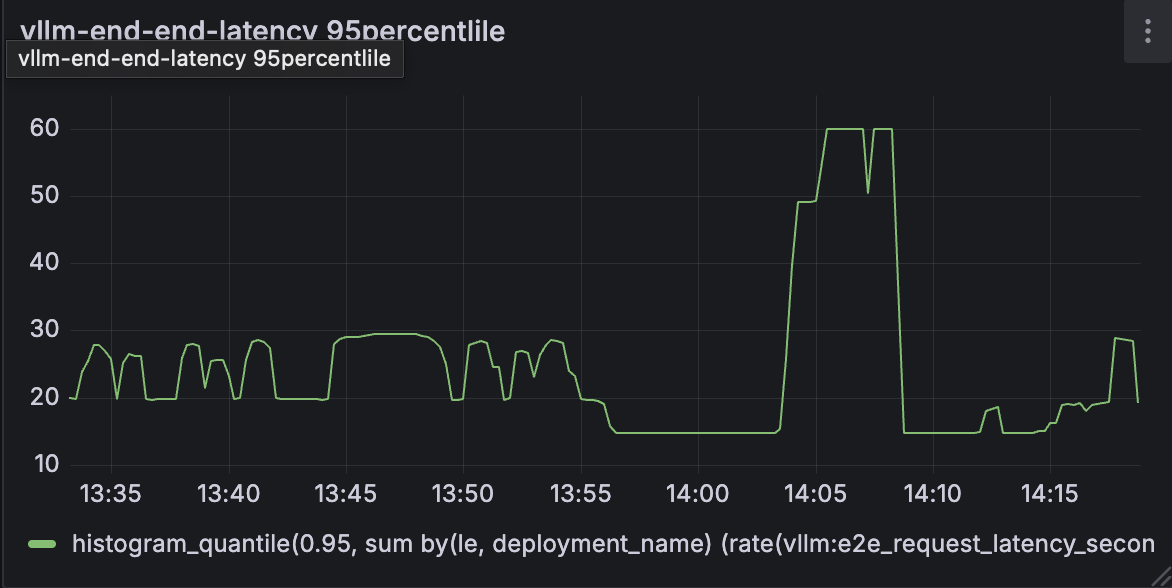
- Inference latency - 95th percentile end-to-end inference latency ranged from 20–30s in steady state and peaked at 60s, closely matching Locust's global response time trends. This correlation reinforces that the primary delay stems from model inference itself, not the serving infrastructure.
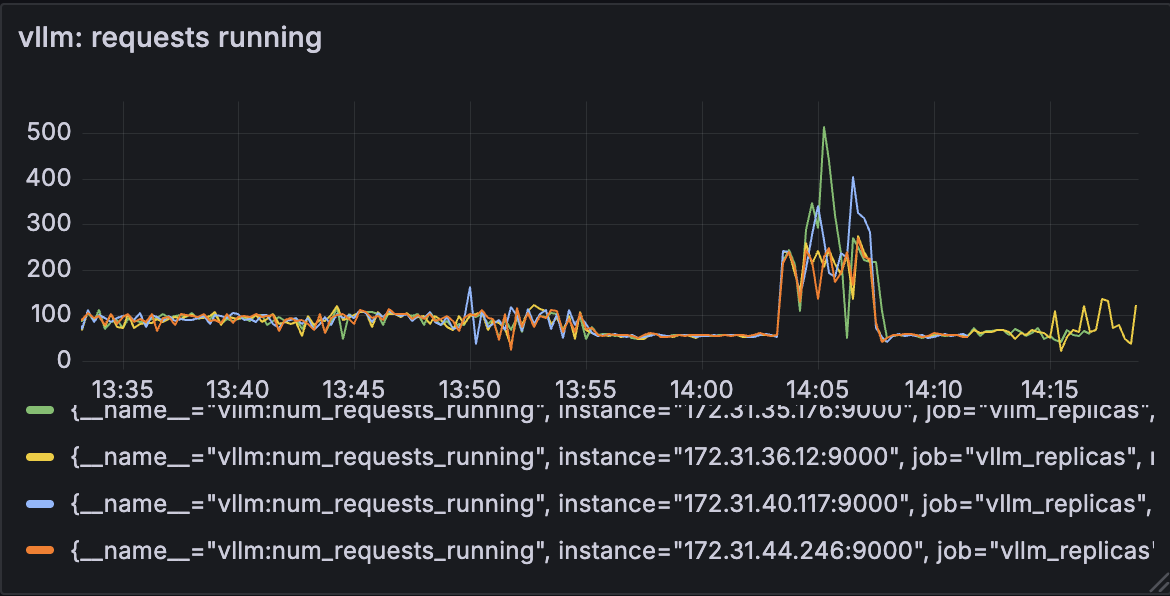
- Load balancing - Load was balanced effectively, with each replica handling 100–200 concurrent requests. I observed a momentary spike on individual replicas, which is an expected artifact of the "least-loaded" routing strategy during intense request bursts. While the system self corrects in seconds, a future refinement could use a Round-robin strategy to guarantee even distribution.
These metrics confirm that system overhead was minimal, the latency increase came from the model itself, not the control or data pipeline. Load was distributed evenly, and system responsiveness was preserved under pressure.
Future Improvements
As the system evolves, there are a few key areas I’d like to build which include:
- Autoscaling with SLOs: Dynamically scale replicas based on response times and queue depth.
- Persistent Storage: Explore storage options for presistence and fault tolerance.
- Model Optimization: Explore smarter batch aware scheduling, higher GPU utilization through better packing, running multiple models per node, and support for quantized inference (4-bit/8-bit) to improve performance and resource efficiency.
I plan to explore each in detail in future blog posts.
Closing Thoughts
This project gave me a hands on understanding of what it takes to build a streaming inference engine from the ground up. Confronting real world bottlenecks and user traffic taught me that great infrastructure is a constant balance of trade-offs.
If you're building in this space, I'd love to connect. I'm always open to hearing new ideas, discussing alternative designs, or exploring potential collaboration.
You can find the full project here: GitHub - Model Serving System